Structural Intelligence Group (SIG) develops patent-protected technology in fluid dynamics and structural mechanics, with applications spanning motorsport, marine, medical, and defence sectors. Our full site is currently in development. For enquiries, please contact [email protected].

SIG Discovery analyses your reports, notes, and internal documents to find the connections your own people haven't spotted yet — because no single person reads everything, everywhere, all the time.
THE PROBLEM:Every organisation generates more documents than any one person can hold in their head. Marketing writes a quarterly review. Customer Success logs recurring issues. Engineering notes what's being deprioritised. Finance flags numbers that don't add up. Each team is right about their own piece. Almost nobody reads all four documents side by side — so the connections between them go unnoticed until they show up as a bigger problem months later.That's not a people problem. It's a bandwidth problem. And it's exactly the kind of problem worth automating.THE SOLUTION:SIG Discovery reads across your documents and surfaces the connections a single read-through misses.Upload your reports, meeting notes, research archive, or internal documentation. Our analysis engine builds a map of how concepts, issues, and themes recur and connect across everything you've submitted — then delivers a clear, specific brief on what's actually connected, in plain business language.You don't get a spreadsheet of statistics. You get the thing a very well-read colleague would tell you if they'd actually had time to read every document your organisation produced this quarter.HOW IT WORKS:1. Submit your documents. Any mix of reports, notes, or internal write-ups — the more you share, the more the analysis finds. Handled securely; your documents are never used for anything beyond your own analysis.2. We run the analysis. Our engine processes the full set, mapping recurring concepts and cross-document connections that wouldn't be visible from reading any single file.3. You receive your report within 24–48 hours. A clear, actionable brief — not a data dump — telling you what's actually connected and what to do about it.PRICING:Tier 1 — Raw Analysis: £500The full structural output: every concept identified, every cross-document connection found, delivered as a detailed technical report. Best for teams who want to do their own interpretation, or who want the underlying data alongside a summary.Tier 2 — Executive Briefing: £2,500Everything in Raw Analysis, translated into a two-page narrative brief written for decision-makers: the headline finding, what it's likely costing you, and specific next steps. This is the one most clients want.(Enterprise / recurring analysis — enquire directly for organisations wanting monthly or quarterly cross-document monitoring.)WHO THIS IS FOR:Any organisation generating enough internal documentation that no single person reads all of it — consultancies, research teams, growing companies with multiple departments producing independent reports, legal teams reviewing large document sets, or anyone who's ever thought "I know we've discussed this somewhere, I just can't remember where."FAQ:What happens to our documents after analysis?
Your documents and results are handled confidentially and are never used for any purpose beyond producing your report. Your documents are used solely to produce your report and are deleted from our systems within 30 days of delivery, unless you request otherwise.What file types can we submit?
We accept documents in .md (Markdown), .docx (Word), and .txt (plain text) format.How much documentation do we need to submit for this to be useful?
More documents give richer, more reliable results. As a rough guide, aim for at least a dozen substantial documents — a handful of short notes won't give the analysis enough to work with.How is this different from just asking an AI chatbot to summarise our documents?
A chatbot summarises what's in front of it. This maps how concepts recur and connect across every document you submit simultaneously — surfacing patterns that span documents nobody read together.Find out what your own documents already know.Start Your Analysis Below

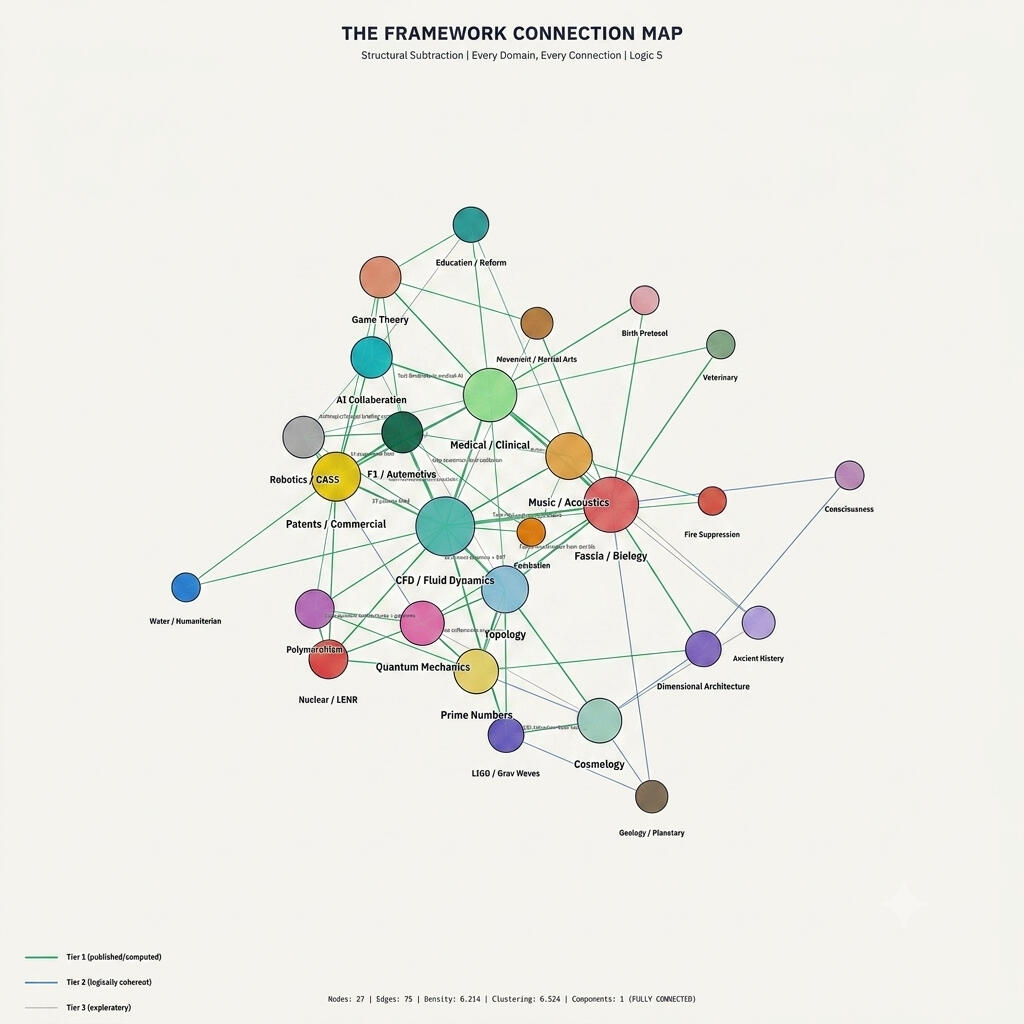
One principle. Twenty-seven domains. Seventy-five verified connections. Every node on this map is a field of research or application where our methodology has been tested — from fluid dynamics and medical diagnostics to music, robotics, and cosmology. Every line is a demonstrated connection between domains, verified through computational simulation, published literature, or clinical observation.The map is fully connected: every domain reaches every other domain through the underlying methodology. This isn't a collection of separate ideas. It's one unified architecture expressed across every scale and substrate we've tested it against. We haven't found a domain where it doesn't apply. We're still looking.
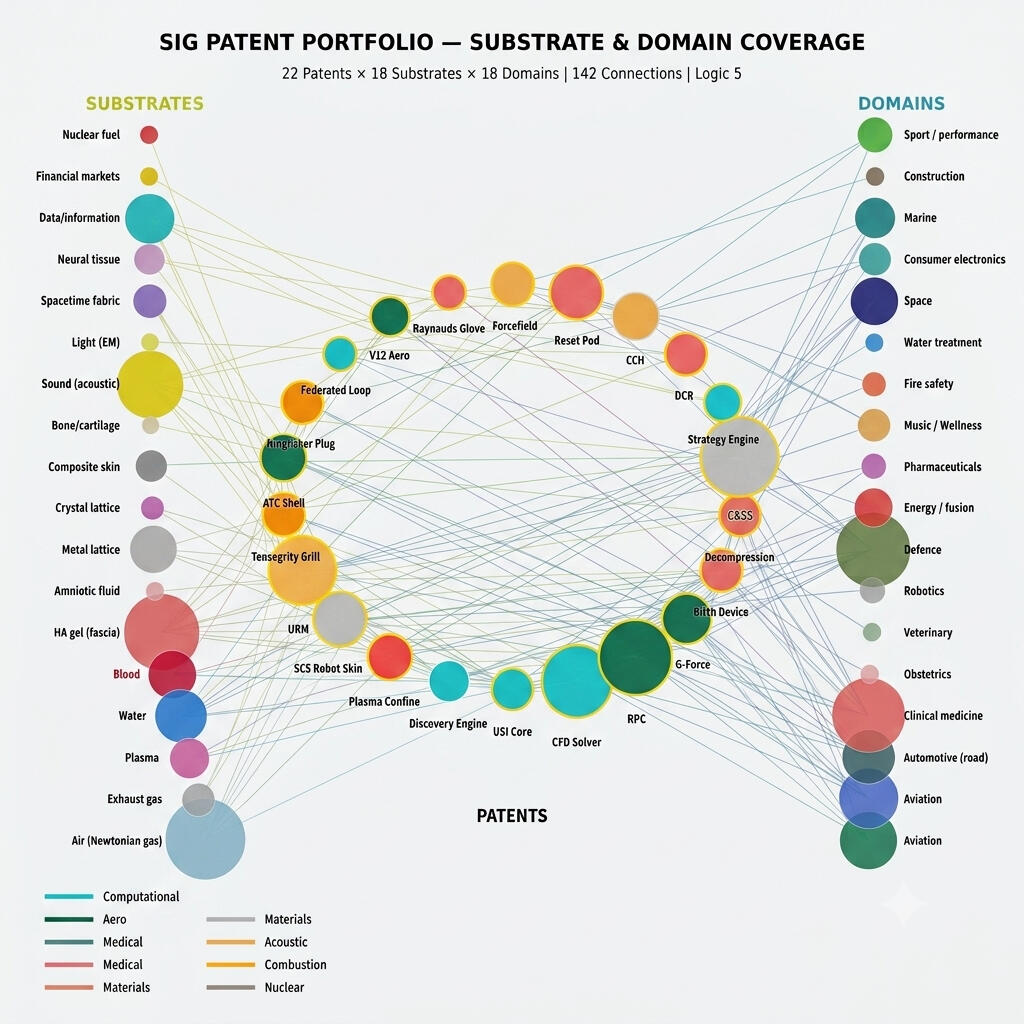
Our intellectual property portfolio mapped against every physical substrate and commercial domain it protects. Left axis: the materials and media our patents operate on, from biological tissue to plasma. Right axis: the industries they apply to, from clinical medicine to aerospace to energy. Centre: the patents themselves, each positioned by what it touches and what it protects.The connections show which patents cover which substrates in which domains. The gaps show where we're filing next. Twenty Two UK patent applications filed. 175 claims across fluid dynamics, active flow control, biomechanics, materials science, robotics, combustion, computational architecture, and resonance manipulation. Every gap on this map is a future filing. The map grows every month.